
As always, if your GUI (or docs) don’t match – check your versions!
How to!
I’m working with PC 2024.2-on-AOS 6.10-on-AHV in a nested environment. One 1 node cluster, one 3-node cluster. Each has its own Prism Central (the main difference vs 1 shared PC is not Availability Zone). The clusters are all on the same network (so it mimics a stretched network).
I’ll need to do some other posts on troubleshooting and Recovery Plans.
Step 1:
Log into each Prism Central and Enable DR.
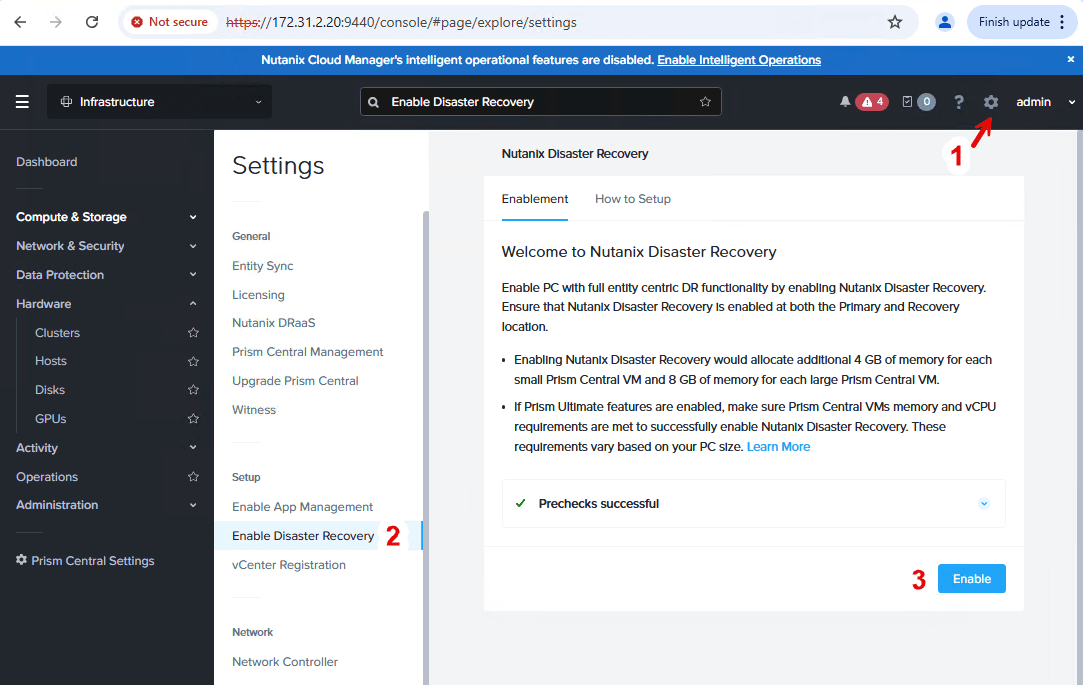
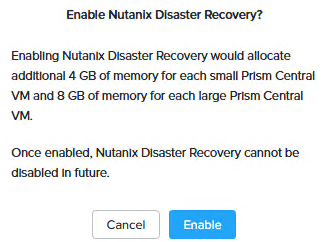
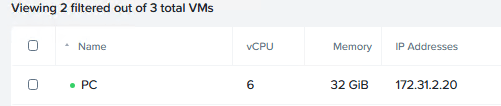
You will be prompted to expand the memory in Prism Central. In my case my PCVMs will go from 28
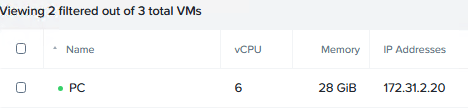
to 32GB after the process runs
Step 2:
Connect to the other Availability Zone. For on-prem clusters, each Prism Central (and its clusters) acts as an Availability Zone.
If you have two clusters (physically close or separated by distance) you can replicate from one to the other without changing the AZ settings first.
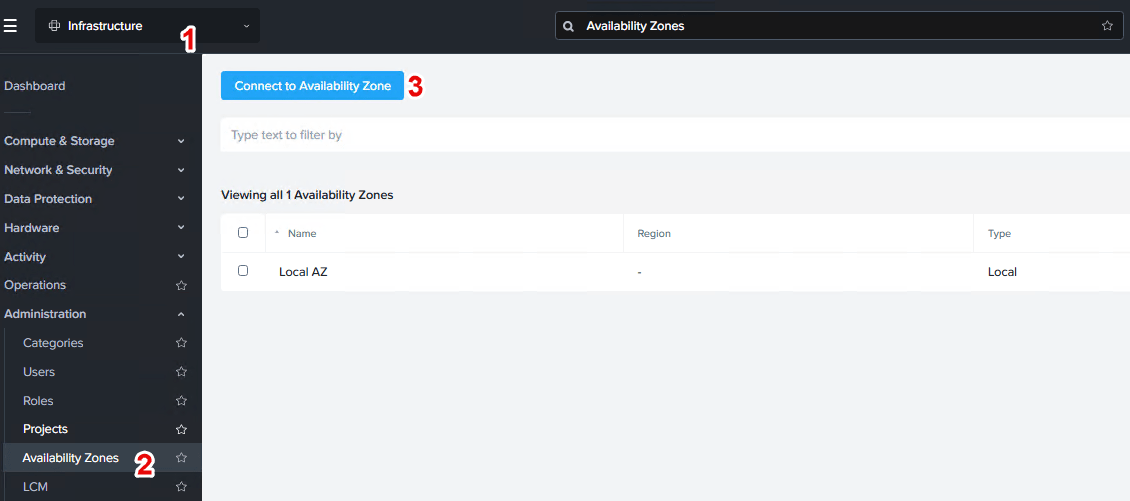
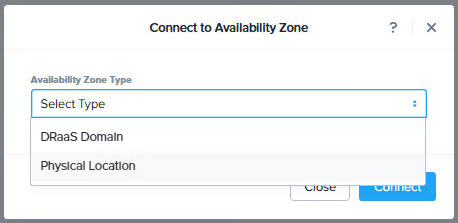
Note the option to connect to DRaas (Nutanix Cloud AS or Nutanix Cloud Cluster AZ). Here we want to pick Physical Location.
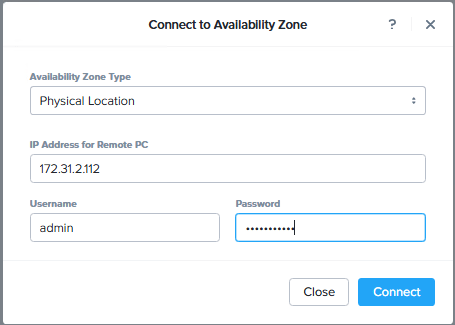
This gives us prompts for IP address for the other Prism Central and credentials to Connect.
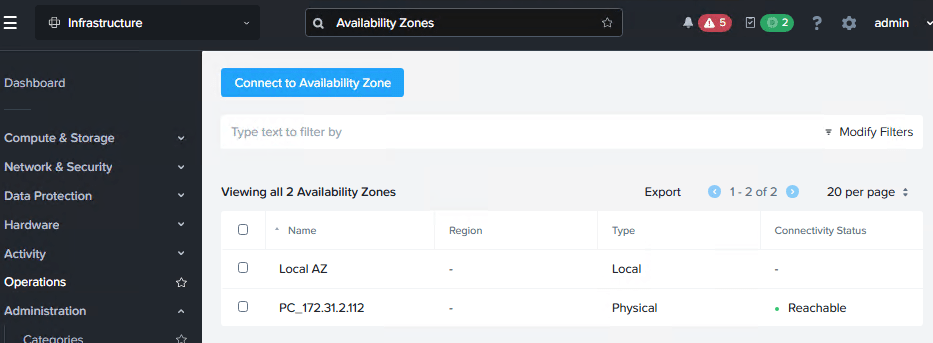
note the only option here is to disconnect the remote PC – and you have to check the AZ to get that option to popup
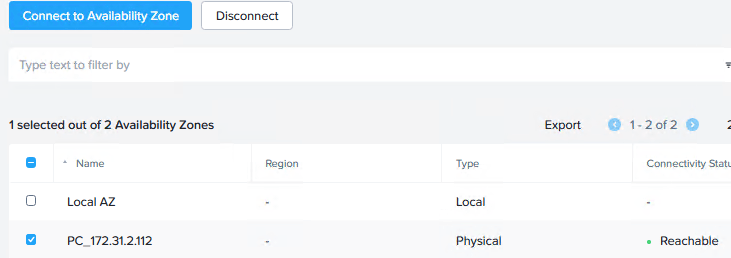
If you check on the remote PC you’ll see an AZ has been setup for the primary site automatically.

Step 3:
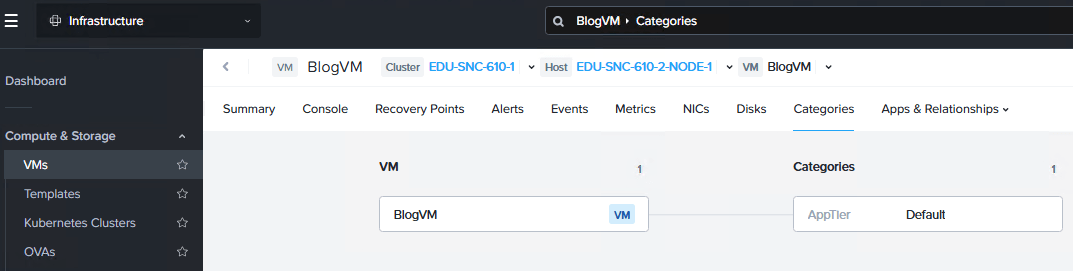
Before you create a Protection Policy you’ll need to have at least one category associated with the VMs to protect. You can add them a few ways, once added you can check using the “Categories” tab on the VM.
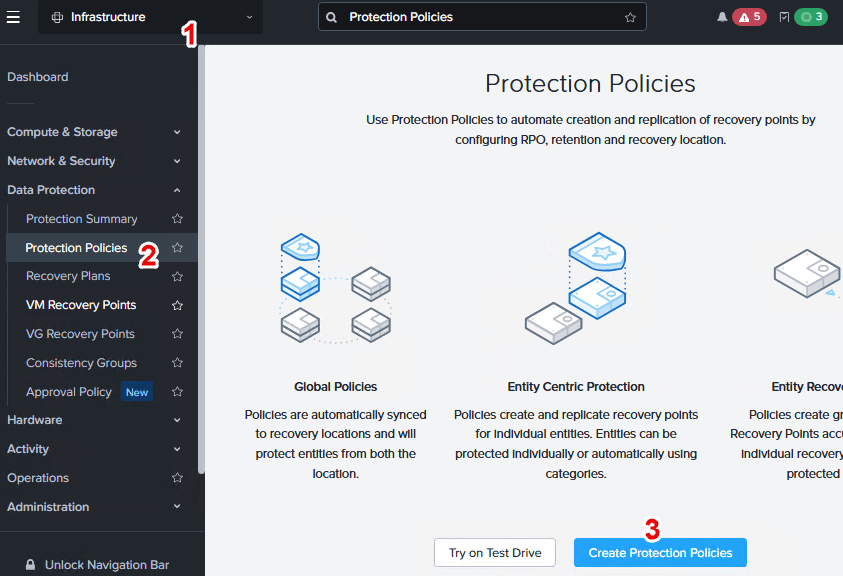
The first time you’ll get an explanation screen, just click Create
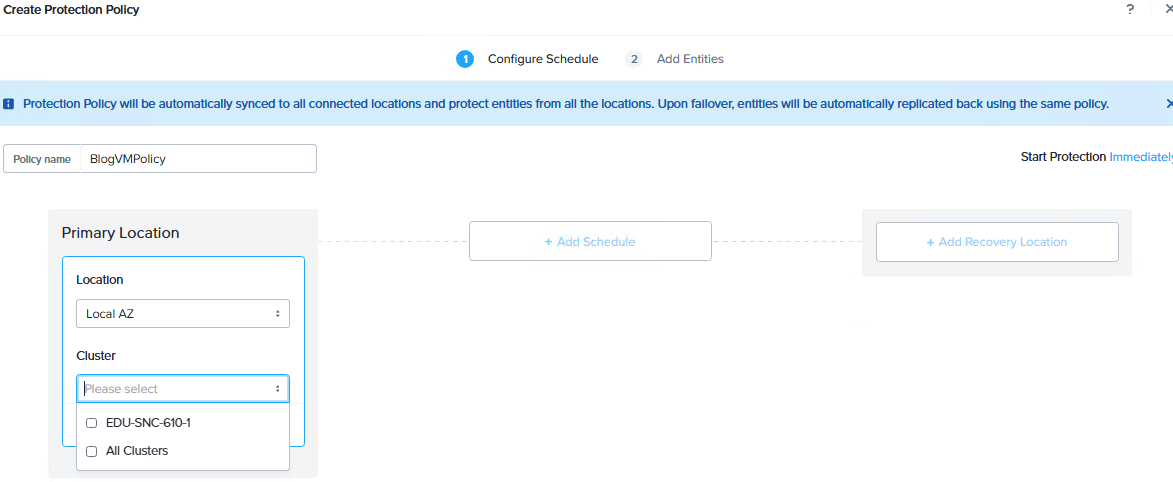
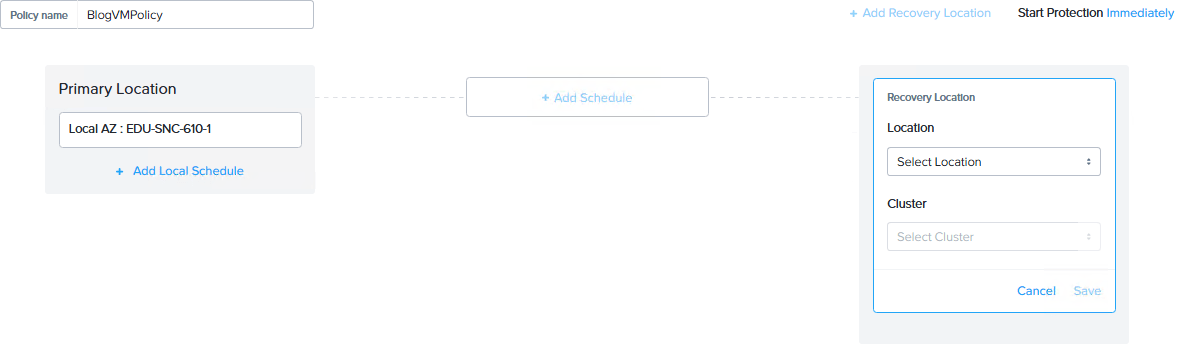
Enter a name for the policy and click the appropriate cluster in the drop down.
Click Save to start the Recovery Location widget. And note now you can also add a local schedule to the Primary Location.
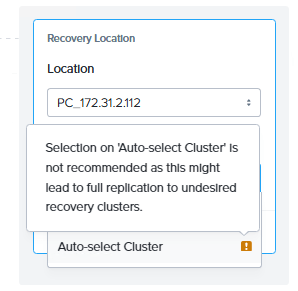
You can see that “Auto-select Cluster” is an option but not recommended. Here, pick your desired remote cluster and click Save.
Click Add Schedule
Here you can choose either Asynchronous (1-15min RPO with NearSync or 1+ hour RPO with Async) or Synchronous (0min RPO).
To use NearSynch choose Minutes and then set a value from 1 to 15. No other values are allowed.
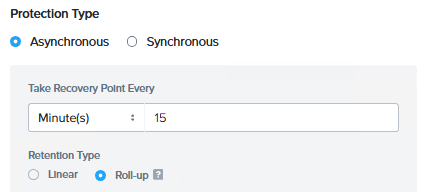
Retention Type Soliloquy
When you choose NearSync you are also limited to Roll-up Retention Type – although you only have a limited range of RPOs where you can choose which Retention Type to use.
1-15min RPO/NearSync uses Roll-up
1-4hour RPO (Async) you are allowed to choose Linear or Roll-up
5+hour RPO (Async) uses Linear
So if you ever wonder why you can’t choose which Retention Type to use during Protection Policy creation, check that table.
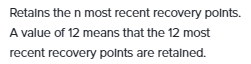
Linear Retention Type tooltip:
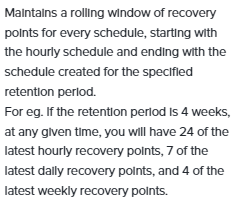
Roll-up Retention Type tooltip:
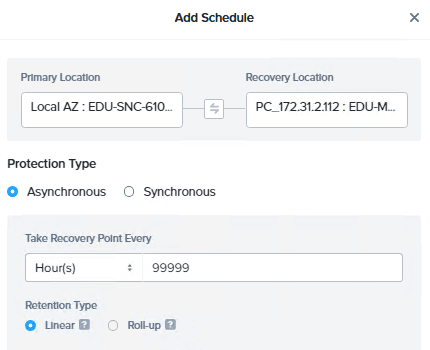
To use Async mode choose Hours (or Days or even Weeks!) and then set a value from 1 to 99999. No other values are allowed (so no setting Minutes to 60 or 90).
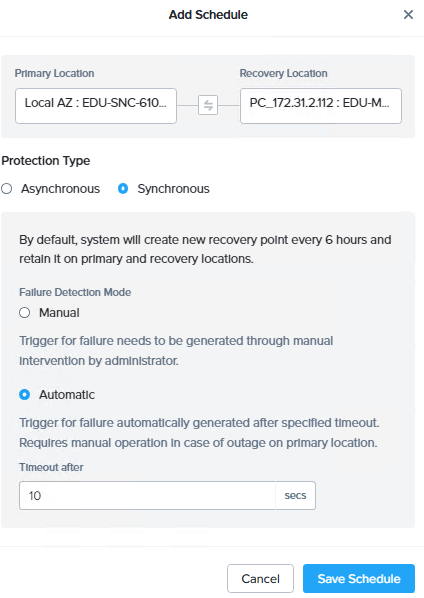
If you want to use Synchronous/Metro choose the Synchronous radio button and then pick Manual or Automatic Failure Detection Mode.
Note that you get these choices because I did not set a Witness up first. But you can Witness a new Blog Post coming soon!
I’m testing Synchronous so lets leave it there and check where we are.
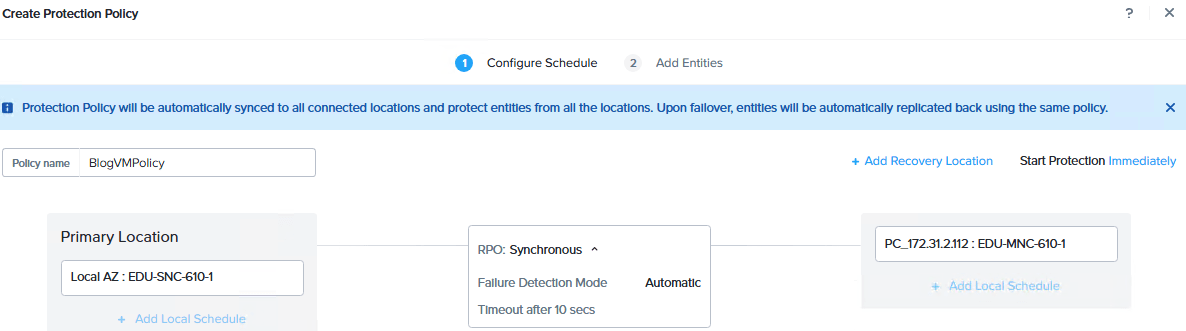
Note that we can choose when to start this schedule, but we want to test it now, so hit Next!
Now we get to pick the category/ies that this Protection Policy will reference.
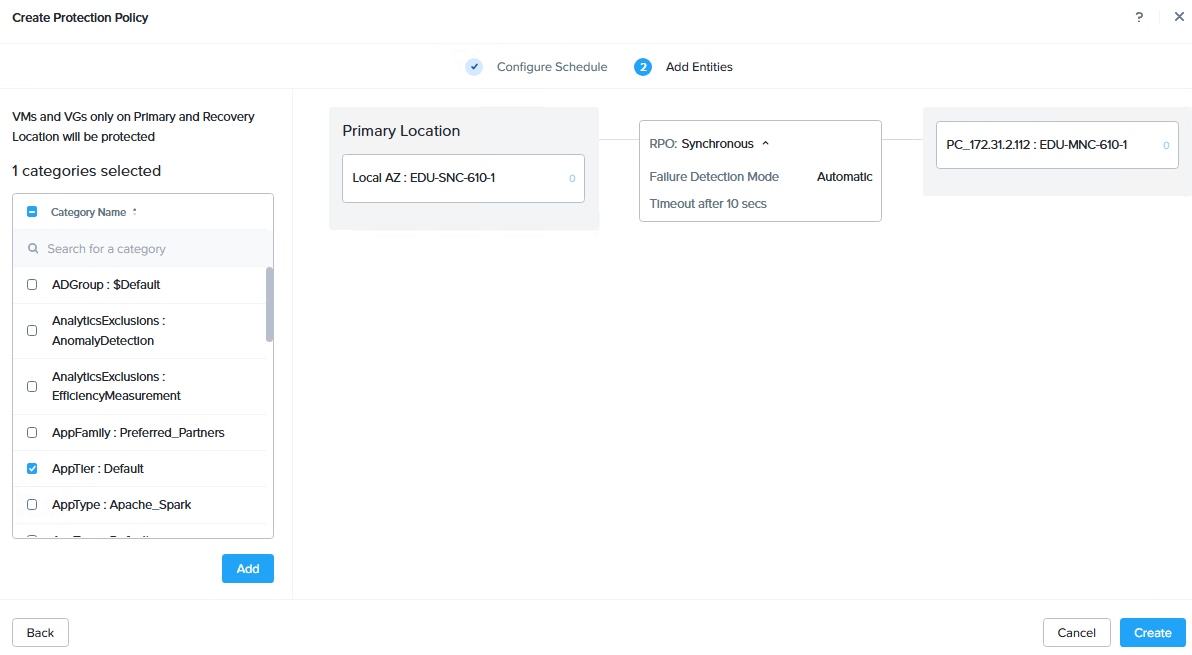
We’ll pick the one we added to the one VM earlier, click Add then Create.
Step 4:
Check the status.
Prism Central view
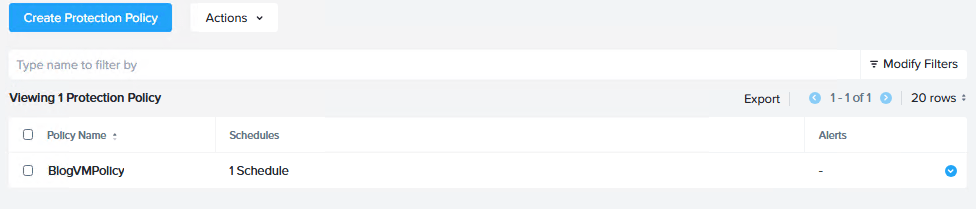
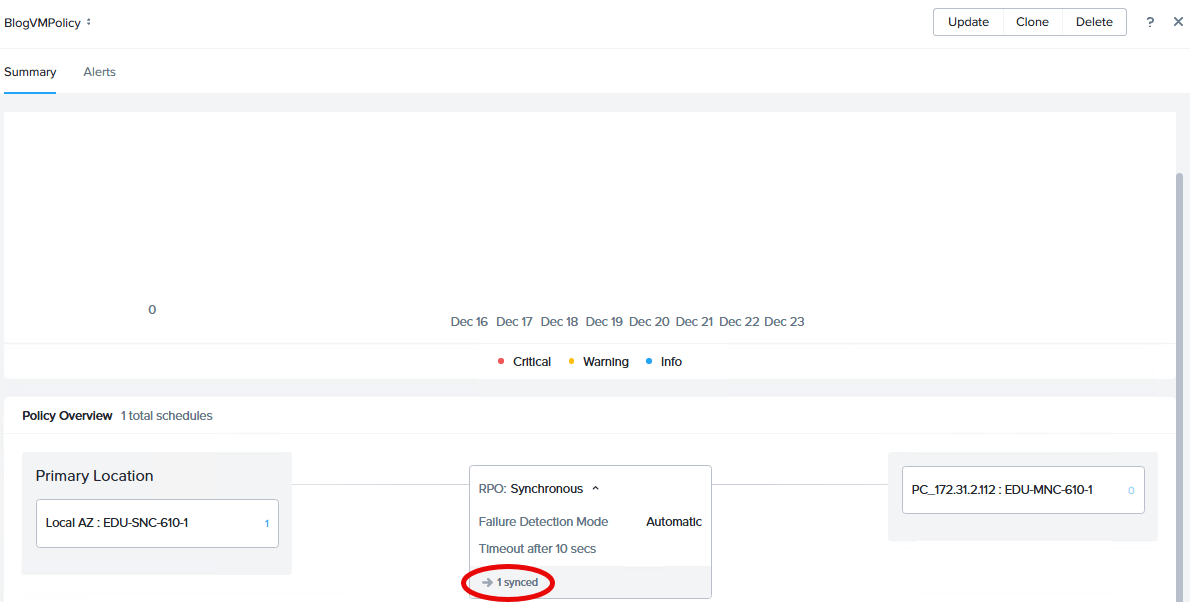
Click the policy name to get a summary tab
Here we can see Alerts by date and the settings we picked. You can also see it it reporting one synched.
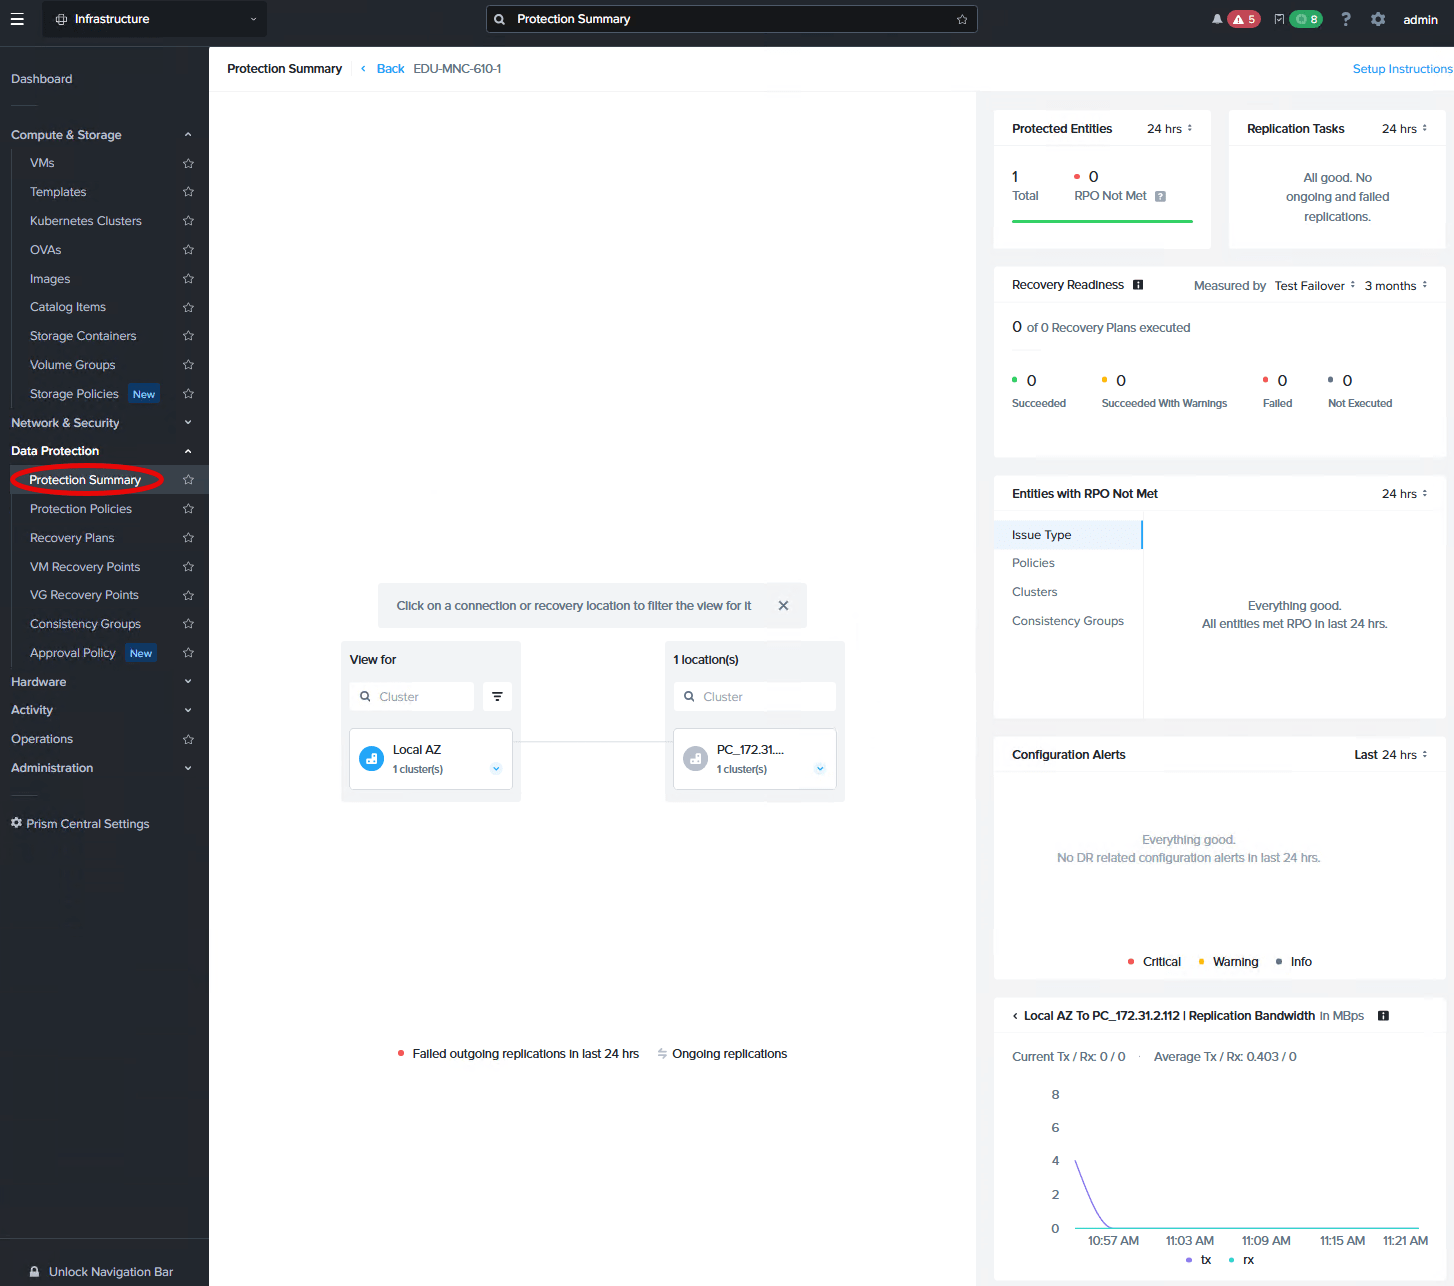
We can also look at the Protection Summary page which shows 1 protected entity and 0 RPO not met. You can also catch a glimpse at the bottom of the tail end of the initial replication (the VM isn’t changing so nothing on going)
Prism Element view
Looking at the Storage Container Usage for the matching (names the same) containers in Prism Element/Storage for each cluster shows the Remote site increasing in size to match.
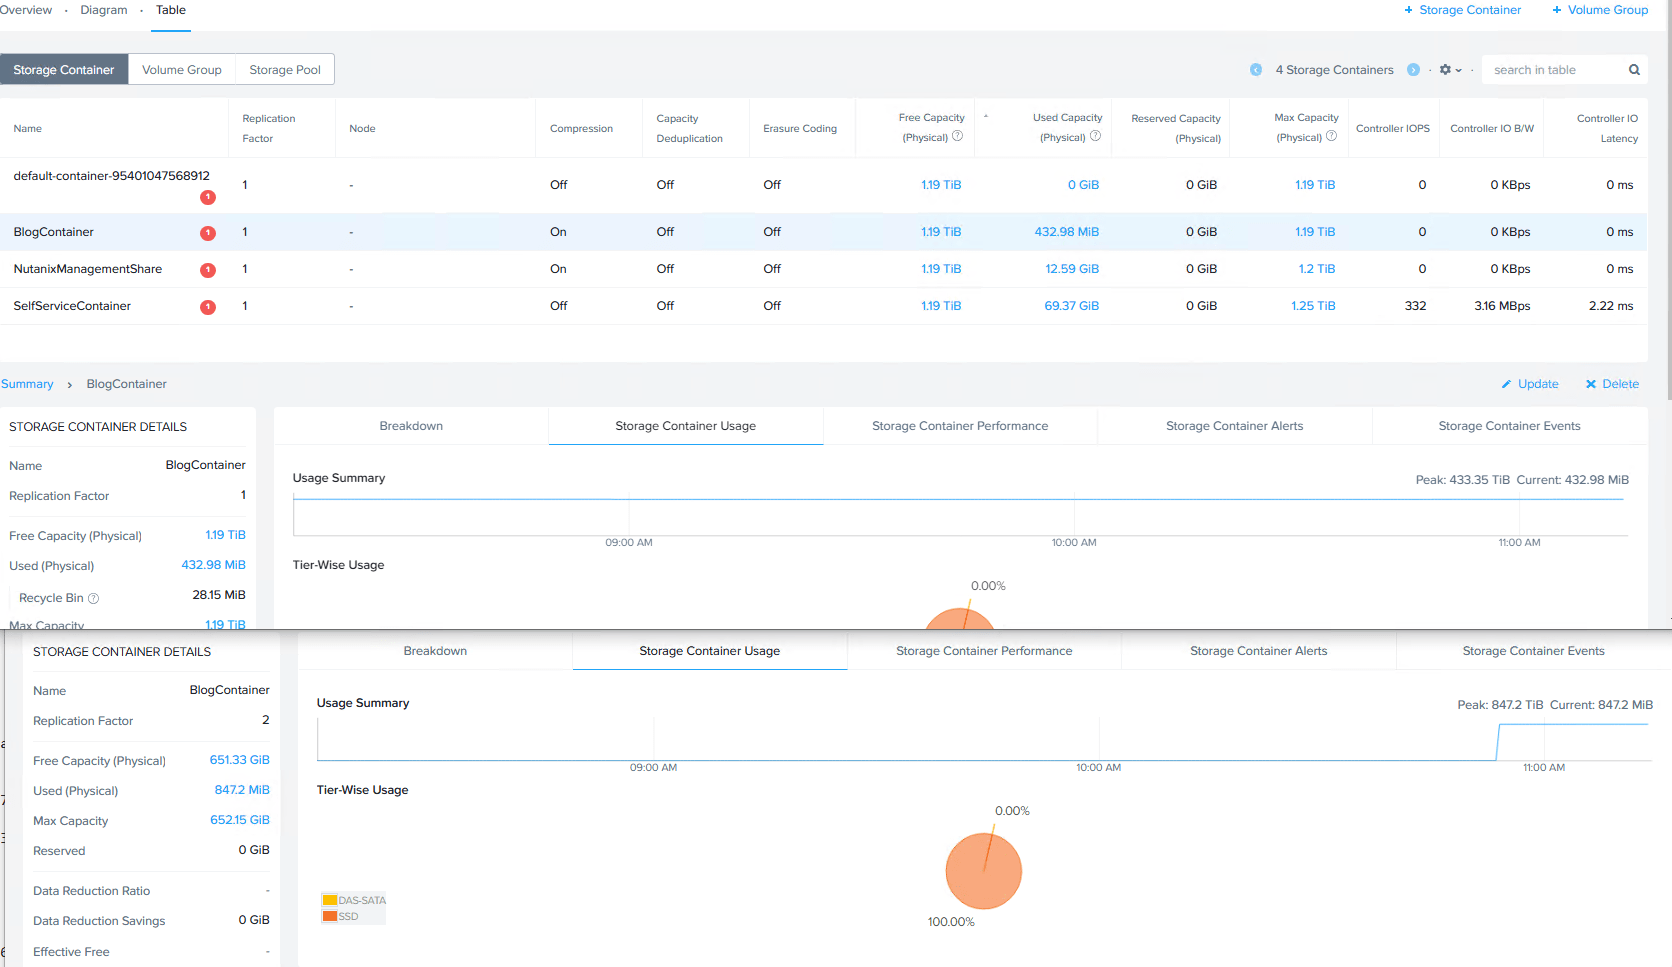
If you look close there is a bug here I probably ought to report – it shows the peak in TiB but the current in MiB.
Speaking of looking close – the Active/Primary/First cluster is the 1-node cluster with a Replication Factor of 1. The destination cluster is the 3-node with a Replication Factor of 2. Thus doubling the storage used.

Thank you Josh for the great post, I appreciate the screen shots and explanation for each step! Looking forward to reading your Witness guide.